Paycheck Calculator
Estimate your US take-home pay after federal, state and payroll taxes in seconds, using 2026 withholding rules.
How Your Paycheck Is Calculated
- Gross payStart with your hourly wage times hours, or salary divided by pay periods, plus overtime and bonuses.
- Pre-tax deductionsSubtract 401(k), health premiums and HSA or FSA contributions that reduce taxable wages.
- Federal and FICA taxesApply 2026 federal withholding, 6.2% Social Security and 1.45% Medicare.
- State and local taxesAdd your state income tax and any state payroll programs, then post-tax deductions to reach net pay.
Deeper explanation: How take-home pay is calculated and gross pay vs net pay.
Popular Paycheck Calculators
Pick the calculator that matches how you are paid.
Hourly Paycheck Calculator
Hourly wage and hours to net pay.
Open calculator →Salary Paycheck Calculator
Annual salary to net pay per check.
Open calculator →Biweekly Paycheck Calculator
26 paychecks a year.
Open calculator →Semimonthly Paycheck Calculator
24 paychecks a year, twice a month.
Open calculator →Weekly Paycheck Calculator
52 paychecks a year.
Open calculator →Monthly Paycheck Calculator
12 paychecks a year.
Open calculator →Overtime Paycheck Calculator
Time-and-a-half and double-time hours.
Open calculator →Paycheck Calculators by State
State income tax ranges from none to over 10%. Choose your state for a calculator, tax explanation and examples built for it.
More Pay Tools and Converters
Convert between salary and hourly pay, find gross from net, and check withholding.
Salary to Hourly Calculator
Annual, monthly or weekly pay to an hourly rate.
Open tool →Hourly to Salary Calculator
Hourly wage to yearly, monthly and biweekly pay.
Open tool →Annual Income Calculator
Gross yearly income plus a take-home estimate.
Open tool →Net to Gross Calculator
Gross pay needed for a target take-home.
Open tool →Pay Stub Calculator
Estimate each line of a pay stub.
Open tool →Tax Withholding Calculator
Federal withholding per paycheck and per year.
Open tool →Income Tax Calculator
Federal and state income tax on your wages.
Open tool →Paycheck Guides
Paycheck Taxes
Every tax that can come out of a paycheck, and who sets it.
Read guide →Federal Income Tax Withholding
2026 brackets, standard deductions and the 22% bonus rate.
Read guide →Social Security Tax
6.2% up to $184,500 in 2026.
Read guide →Medicare Tax
1.45% on all wages plus 0.9% above $200,000.
Read guide →Paycheck Deductions
Pre-tax and after-tax deductions and how they change take-home pay.
Read guide →W-4 Withholding
The five steps of Form W-4 and what each does.
Read guide →Bonus Tax on Your Paycheck
Why bonus checks look small and what you really keep.
Read guide →How to Read a Pay Stub
Every line on a pay stub, explained.
Read guide →Pay Frequency Explained
Weekly, biweekly, semimonthly and monthly compared.
Read guide →More:

How Take-Home Pay Is Calculated: The 4-Step Mathematical Waterfall
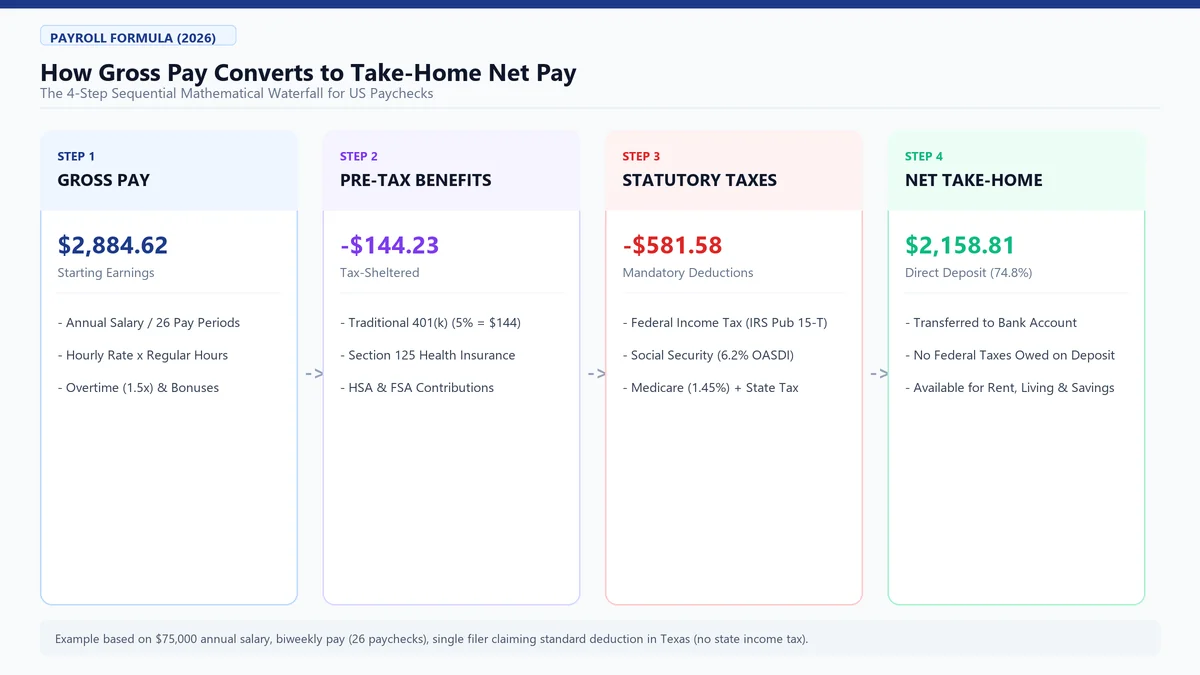
Take-home pay (net pay) is the exact amount deposited into an employee's bank account after all mandatory statutory taxes and voluntary benefit deductions are subtracted from gross earnings. The universal payroll formula follows a strict sequential waterfall:
Net Take-Home Pay = Gross Pay - Pre-Tax Deductions - Federal Income Tax - FICA (7.65%) - State/Local Taxes - Post-Tax Deductions
1. Gross Earnings Calculation
For salaried employees, gross pay is your annual salary divided by your pay periods (52 weekly, 26 biweekly, 24 semimonthly, 12 monthly). For hourly workers, it is hourly rate multiplied by regular hours, plus 1.5x for overtime hours.
2. Pre-Tax Deductions (Taxable Base Reduction)
Traditional 401(k) contributions, Section 125 health insurance premiums, Health Savings Accounts (HSA), and FSAs come out before taxes, lowering your overall taxable gross income.
3. Mandatory Statutory Tax Withholding
Employers deduct three mandatory tax layers: Federal Income Tax (FIT) based on your Form W-4, Social Security (6.2% up to $184,500), Medicare (1.45% plus 0.9% surtax), and state/local income taxes.
4. Post-Tax Deductions & Final Net Pay
Roth 401(k) deferrals, union dues, and wage garnishments are subtracted last, leaving your final net take-home deposit.
The Core Components of Your Paycheck Deductions
Understanding each deduction on your pay stub ensures accurate withholding and prevents unexpected tax liabilities at year-end:
- Federal Income Tax Withholding: A progressive system with seven brackets from 10% to 37%. Figured using IRS Publication 15-T methods and your Form W-4 filing status.
- FICA (Social Security & Medicare): 6.2% Social Security on wages up to the $184,500 cap for 2026, plus 1.45% Medicare on all earnings (and 0.9% Additional Medicare on wages exceeding $200,000 for single filers).
- State & Local Income Taxes: Ranging from 0% in nine states (Alaska, Florida, Nevada, New Hampshire, South Dakota, Tennessee, Texas, Washington, Wyoming) to progressive brackets over 10% in high-tax states.
From Gross to Net: The Same Salary in Three States
Federal tax and FICA are identical nationwide, so geographic variations in net pay come entirely from state income taxes and state payroll programs.
| $75,000, biweekly, single | Gross | Net per check | Net per year | Tax rate |
|---|---|---|---|---|
| Texas | $2,884.62 | $2,368.94 | $61,592 | 17.9% |
| California | $2,884.62 | $2,224.22 | $57,830 | 22.9% |
| New York | $2,884.62 | $2,222.47 | $57,784 | 23% |
See each state page for its own breakdown, or read gross pay vs net pay.
Take-Home Pay by State (50 States + DC Ranking Index)
Annual take-home pay on a $75,000 salary, single filer claiming standard deduction with no pre-tax benefits, ranked from highest to lowest.
| Rank | State | Take-home / year | Total tax / year | Tax rate |
|---|---|---|---|---|
| 1 | Florida | $61,592 | $13,408 | 17.9% |
| 2 | Nevada | $61,592 | $13,408 | 17.9% |
| 3 | New Hampshire | $61,592 | $13,408 | 17.9% |
| 4 | South Dakota | $61,592 | $13,408 | 17.9% |
| 5 | Tennessee | $61,592 | $13,408 | 17.9% |
| 6 | Texas | $61,592 | $13,408 | 17.9% |
| 7 | Wyoming | $61,592 | $13,408 | 17.9% |
| 8 | North Dakota | $61,389 | $13,611 | 18.1% |
| 9 | Alaska | $61,322 | $13,678 | 18.2% |
| 10 | Washington | $60,550 | $14,450 | 19.3% |
| 11 | Ohio | $60,312 | $14,688 | 19.6% |
| 12 | Arizona | $60,120 | $14,880 | 19.8% |
| 13 | Louisiana | $59,729 | $15,271 | 20.4% |
| 14 | South Carolina | $59,432 | $15,568 | 20.8% |
| 15 | Indiana | $59,410 | $15,590 | 20.8% |
| 16 | Iowa | $59,394 | $15,606 | 20.8% |
| 17 | Mississippi | $59,324 | $15,676 | 20.9% |
| 18 | Pennsylvania | $59,290 | $15,710 | 20.9% |
| 19 | New Mexico | $59,233 | $15,767 | 21% |
| 20 | North Carolina | $59,109 | $15,891 | 21.2% |
| 21 | Vermont | $59,103 | $15,897 | 21.2% |
| 22 | Kentucky | $59,085 | $15,915 | 21.2% |
| 23 | Nebraska | $59,060 | $15,940 | 21.3% |
| 24 | West Virginia | $59,047 | $15,953 | 21.3% |
| 25 | Arkansas | $59,016 | $15,984 | 21.3% |
| 26 | Missouri | $59,000 | $16,000 | 21.3% |
| 27 | New Jersey | $58,824 | $16,176 | 21.6% |
| 28 | Oklahoma | $58,763 | $16,237 | 21.6% |
| 29 | Idaho | $58,726 | $16,274 | 21.7% |
| 30 | Montana | $58,716 | $16,284 | 21.7% |
| 31 | Colorado | $58,671 | $16,329 | 21.8% |
| 32 | Connecticut | $58,668 | $16,332 | 21.8% |
| 33 | Michigan | $58,656 | $16,344 | 21.8% |
| 34 | Wisconsin | $58,649 | $16,351 | 21.8% |
| 35 | Georgia | $58,598 | $16,402 | 21.9% |
| 36 | Rhode Island | $58,572 | $16,428 | 21.9% |
| 37 | Utah | $58,445 | $16,555 | 22.1% |
| 38 | Maryland | $58,396 | $16,604 | 22.1% |
| 39 | Kansas | $58,207 | $16,793 | 22.4% |
| 40 | Washington DC | $58,164 | $16,836 | 22.4% |
| 41 | Alabama | $58,108 | $16,892 | 22.5% |
| 42 | Virginia | $58,094 | $16,906 | 22.5% |
| 43 | Illinois | $58,025 | $16,975 | 22.6% |
| 44 | Delaware | $57,984 | $17,016 | 22.7% |
| 45 | California | $57,830 | $17,170 | 22.9% |
| 46 | Maine | $57,806 | $17,194 | 22.9% |
| 47 | New York | $57,784 | $17,216 | 23% |
| 48 | Massachusetts | $57,718 | $17,282 | 23% |
| 49 | Minnesota | $57,686 | $17,314 | 23.1% |
| 50 | Hawaii | $57,423 | $17,577 | 23.4% |
| 51 | Oregon | $55,260 | $19,740 | 26.3% |
How Pay Frequency Changes Each Paycheck
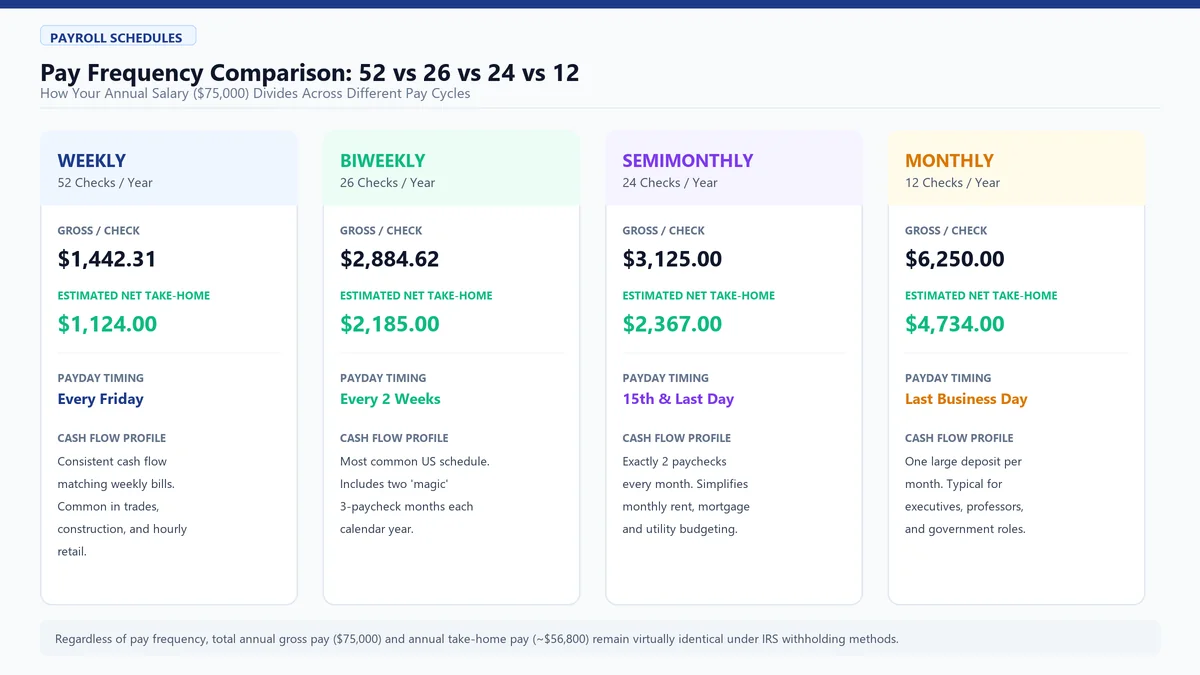
Annual take-home pay remains virtually identical across pay schedules; what changes is the size of each deposit. On a $75,000 salary in Texas, weekly checks are smaller than biweekly checks, but the yearly total is unchanged.
| Pay frequency | Gross per check | Net per check |
|---|---|---|
| Weekly (52) | $1,442.31 | $1,184.47 |
| Biweekly (26) | $2,884.62 | $2,368.94 |
| Semimonthly (24) | $3,125.00 | $2,566.35 |
| Monthly (12) | $6,250.00 | $5,132.71 |
| Annual (1) | $75,000.00 | $61,592.50 |
Compare schedules: weekly (52), biweekly (26), monthly (12).
Pre-Tax vs. Post-Tax Deductions: How to Maximize Wealth
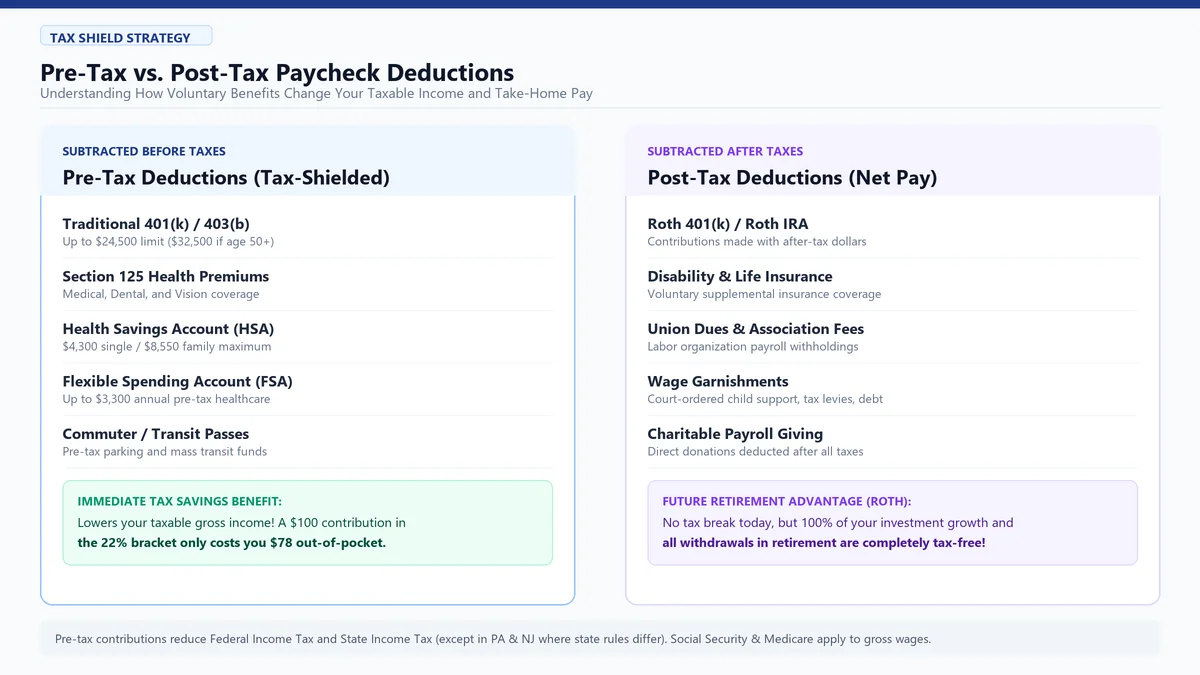
Deductions differ fundamentally in their tax timing:
- Pre-Tax Deductions: Subtracted before taxes. If you are in the 22% federal bracket, contributing $100 to a traditional 401(k) or HSA only reduces take-home pay by $78 because you save $22 in taxes immediately.
- Post-Tax Deductions: Subtracted after taxes (like Roth 401(k) or disability insurance). Your paycheck falls by the full $100, but qualified withdrawals in retirement are completely tax-free.
Supplemental Wages, Bonuses, and Overtime Pay Mechanics
Bonuses and supplemental wages are typically withheld at a flat 22% federal rate upfront, though your actual tax liability reconciles at your marginal bracket when filing your return. Non-exempt hourly overtime is paid at 1.5x base rate under the FLSA. Learn more in how bonuses are withheld and the overtime paycheck calculator.
5 Actionable Strategies to Increase Your Take-Home Pay
- Raise pre-tax contributions. Every $1,000 into a traditional 401(k), HSA or health FSA lowers taxable wages, so take-home falls by less than $1,000.
- Fix a large refund. If you get a refund every spring you are over-withholding. Update your W-4 so the money arrives in your paychecks instead.
- Claim credits you qualify for. Step 3 of the W-4 reduces withholding by $2,200 per qualifying child under 17.
- Check the second job. Two incomes without the W-4 Step 2 adjustment lead to under-withholding and a bill in April.
- Watch benefit elections in open enrollment. A cheaper health plan or a higher HSA election changes every paycheck.
How these numbers are figured: 2026 IRS withholding rules (Publication 15-T) and state figures last verified September 2026. Results are estimates. Read the full methodology and sources.
Frequently Asked Questions
How is take-home pay calculated in 2026?
Take-home pay is calculated by taking gross wages, subtracting pre-tax deductions (such as traditional 401k and health premiums), and deducting federal income tax, 6.2% Social Security, 1.45% Medicare, and state/local taxes. See how take-home pay is calculated.
What is the Social Security wage cap for 2026?
The Social Security taxable wage base limit for 2026 is $184,500. Earnings above this threshold are exempt from the 6.2% Social Security tax for the remainder of the calendar year.
What taxes are deducted from my paycheck?
Federal income tax, Social Security (6.2%), Medicare (1.45%), and state and local income taxes in most states. See paycheck taxes explained.
How accurate is this paycheck calculator?
It uses official 2026 IRS Publication 15-T percentage methods and verified state tax brackets. Your employer's payroll may differ slightly because of exact benefit elections and local taxes.
How does filing status affect my paycheck?
Filing status sets your standard deduction ($16,100 single, $32,200 married filing jointly) and bracket thresholds. See filing status and paycheck taxes.
How do pre-tax deductions save money?
A traditional 401(k), health premium or HSA lowers the wages your income tax is figured on, so take-home pay falls by less than the contribution amount. See paycheck deductions.
Why is my bonus taxed higher than regular pay?
Bonuses are classified as supplemental wages and are commonly withheld at a flat 22% federal rate. If this exceeds your effective tax rate, the excess withholding is refunded when you file your tax return.
Ready to See Your Exact Take-Home Pay?
Free, instant and private. No sign-up and nothing you enter leaves your browser.
Calculate my paycheck